In today’s data-driven world, the ability to visualize and understand information is increasingly important. Whether you’re managing a business, researching a topic, or trying to understand trends, quantitative data is your friend. However, it can be dull and cumbersome to sift through raw numerical data. This is where visual aids like a line chart come into play.
A line graph can turn a table full of confusing numbers into an easily interpreted visual that engages your audience and simplifies understanding. Below, we go into detail about when to use a line chart effectively for data analysis.
Understanding the Function of Line Charts
A line chart is a type of data visualization tool that employs lines connecting data points to show value changes over time. It is ideal for identifying trends and patterns in numerical data, allowing you to track progression and changes over a specified period. Line charts are optimal for presenting continuous data sets.
A successful line chart consists of several key components: the title, axes, scales, line, legend, and labels. Each component plays a critical role in interpreting the data.
For instance, the title gives a generally brief and comprehensive overview of what the graph is all about. The axes represent the reference lines of the line chart, typically demonstrating time versus quantity. Conversely, the scales define the unit of measurement, demonstrating the time intervals of the line chart.
The trend line illustrates the overall direction that the data takes, depicting whether the values increase or decrease over time. The legend explains the symbols, line patterns, and colors used in the chart, facilitating easy comprehension of the graph. Last but not least, the labels describe the individual data points in the line chart.
One of the best scenarios to use a line chart is when observing trends over a given duration. For instance, in business, you might use a line chart to examine sales over a quarter or year. In finance, a line chart could be used to keep track of stock market trends. In contrast, health professionals might track patient recovery over time using a line chart.
Furthermore, a line chart can compare multiple data sets over the same period. For example, it can be used when comparing the performance of several students in a single examination or analyzing the performance of multiple products in the market over a certain timeframe.
Another proper scenario for a line chart is when you have one variable being measured multiple times under different conditions. For instance, measuring temperatures in varying seasons. Lastly, line charts are suitable when you have continuous datasets, where the data collection method allows for values to fall anywhere along a scale.
However, a line chart should not be applied in cases where there are more than five to seven categories of data, as this would make the chart hard to read and interpret.
Analyzing Data Trends with Line Charts
Line charts play a pivotal role in data analysis, particularly in identifying trends and evaluating progress towards goals. They offer a simple, easy-to-understand visual of data trends. This aids in concluding patterns and relationships among datasets.
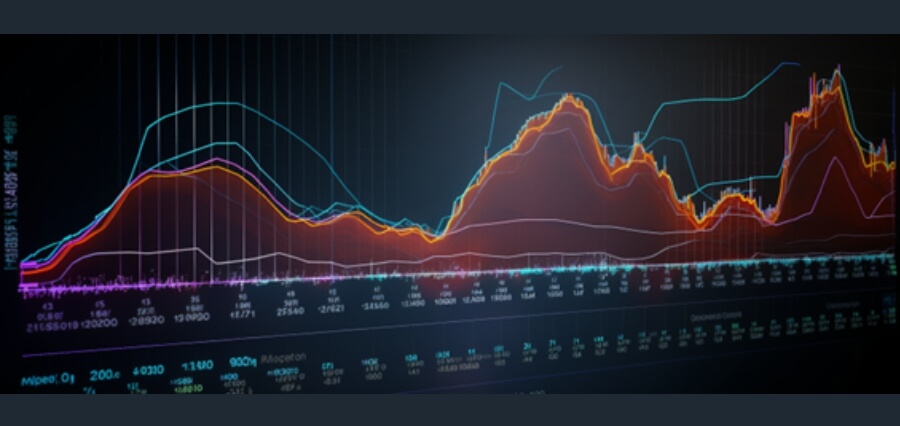
Line charts allow you to identify peaks, valleys, plateaus, and steep slopes in your data. Peaks may signify successful periods, while valleys may be a warning of decline. Plateaus may indicate a stable period and steep slopes can signal a rapid change.
Moreover, line charts can point out seasonal trends and patterns in data, like sales variations in different seasons of the year. They can also identify cyclical patterns. For instance, a line chart could illustrate irregularities in a company’s cash flow model, prompting corrective measures to be taken.
The use of line charts aids in making data-informed decisions based on actual trends and patterns. It can forecast future trends, aiding in proactive measures and strategic decision-making.
Altogether, understanding the function and components of the line chart, knowing when to use it, and understanding its role in analyzing data enables you to leverage line charts in your data interpretation and presentation.


